Export a specio.Spectrum to a pandas.DataFrame
This example illustrates how to export a spectrum into a dataframe which can be useful for some later processing.
Out:
400.199219   402.729828   405.259583   \
20170410EDL_L01_cell01_c1.spc   173.333344   187.333328   188.333328
20170410EDL_L01_cell01_c2.spc   191.111115   203.222229   201.777771
20170410EDL_L01_cell01_c3.spc   195.777771   214.666687   206.333328
20170410EDL_L01_cell01_n1.spc   231.555557   240.888885   250.111099
20170410EDL_L01_cell01_n2.spc   206.444458   222.555557   220.888885

                               407.788513   410.316620   412.843903   \
20170410EDL_L01_cell01_c1.spc   177.666672   187.222229   182.444443
20170410EDL_L01_cell01_c2.spc   193.666672   204.111115   198.777771
20170410EDL_L01_cell01_c3.spc   207.000000   204.777771   209.333328
20170410EDL_L01_cell01_n1.spc   234.444443   252.000000   243.000000
20170410EDL_L01_cell01_n2.spc   226.888885   221.333328   221.000000

                               415.370331   417.895966   420.420746   \
20170410EDL_L01_cell01_c1.spc   178.777786   191.444443   185.111115
20170410EDL_L01_cell01_c2.spc   197.444458   199.666672   199.777771
20170410EDL_L01_cell01_c3.spc   213.555557   211.666672   210.444443
20170410EDL_L01_cell01_n1.spc   245.777771   235.777771   241.444443
20170410EDL_L01_cell01_n2.spc   229.000000   225.666672   229.555557

                               422.943268      ...       3784.909668  \
20170410EDL_L01_cell01_c1.spc   186.888885     ...        105.707924
20170410EDL_L01_cell01_c2.spc   202.555542     ...        103.928505
20170410EDL_L01_cell01_c3.spc   213.333328     ...        101.811989
20170410EDL_L01_cell01_n1.spc   238.333328     ...        104.658981
20170410EDL_L01_cell01_n2.spc   227.444427     ...        112.821648

                               3786.437256  3787.964111  3789.490967  \
20170410EDL_L01_cell01_c1.spc   104.930267   105.930382   109.041618
20170410EDL_L01_cell01_c2.spc   101.259399   109.590294   103.810089
20170410EDL_L01_cell01_c3.spc   102.580002   100.570229   101.671547
20170410EDL_L01_cell01_n1.spc   107.662598   108.332893   106.225388
20170410EDL_L01_cell01_n2.spc   112.157310   111.270737   111.828621

                               3791.018066  3792.543945  3794.069336  \
20170410EDL_L01_cell01_c1.spc   105.041733   108.819626   105.041962
20170410EDL_L01_cell01_c2.spc   103.252106   106.138565   104.913902
20170410EDL_L01_cell01_c3.spc    98.772881   102.652000   101.197777
20170410EDL_L01_cell01_n1.spc   110.006783   102.343719   109.014008
20170410EDL_L01_cell01_n2.spc   109.942055   111.055489   113.391159

                               3795.594482  3797.119141  3798.643555
20170410EDL_L01_cell01_c1.spc   107.153191   106.042191   109.708969
20170410EDL_L01_cell01_c2.spc   108.467026   101.909042   105.128845
20170410EDL_L01_cell01_c3.spc   100.965775   101.178215   101.501770
20170410EDL_L01_cell01_n1.spc   102.462067   104.576797    99.691521
20170410EDL_L01_cell01_n2.spc   109.393486   110.173584   110.509224

[5 rows x 1732 columns]
# Authors: Guillaume Lemaitre <guillaume.lemaire@inria.fr>
# License: BSD3
import matplotlib.pyplot as plt
from specio.datasets import load_csv_path
from specio import specread
# read the spectrum
spectra = specread(load_csv_path())
# convert to a dataframe
df_spectra = spectra.to_dataframe()
# print the head of dataframe
print(df_spectra.head())
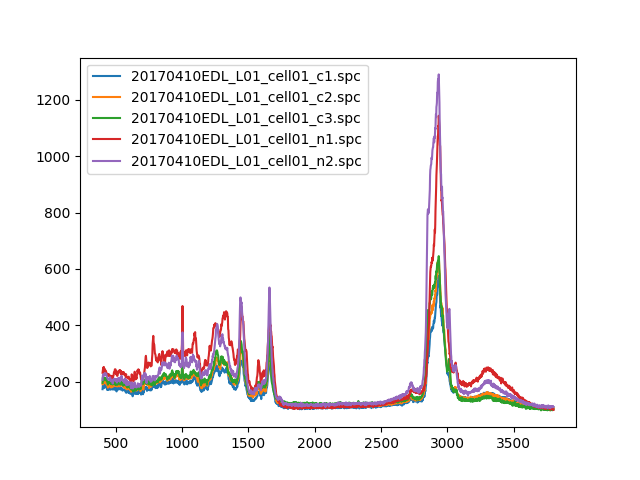
# plot the five first spectra
df_spectra.head().T.plot()
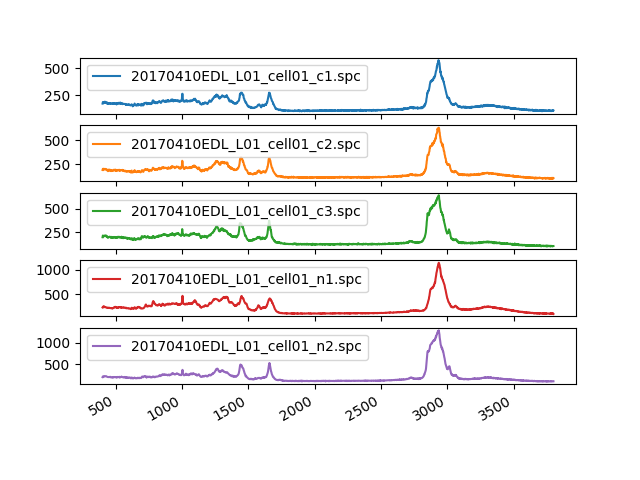
# or on different plots
df_spectra.head().T.plot(subplots=True)
plt.show()
Total running time of the script: ( 0 minutes 3.133 seconds)